On the Main Graph
Right-click the plot for context-sensitive tools: inspecting data, managing fits, and editing points directly on the graph.
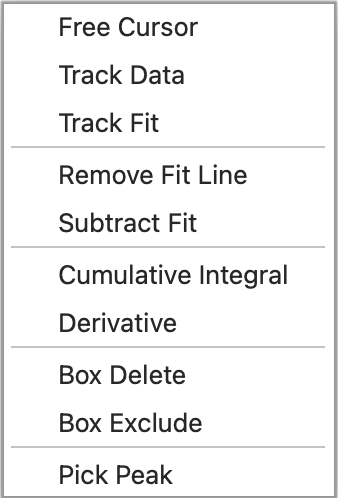
Right-clicking anywhere in the plot area opens a menu whose options depend on the current state of the plot and the tools in use.
01Cursor and tracking tools
The first three options create crosshair cursors for inspecting parts of the graph. The crosshair’s X and Y positions appear at the top-left of the plot (separate from the mouse-position indicator in the toolbar).
- Free Cursor — crosshair follows the mouse freely (not linked to data).
- Track Data — crosshair snaps from point to point, following the mouse’s X position.
- Track Fit — crosshair follows the fitted curve rather than the raw data.
- Track Integral / Track Derivative — follow the cumulative integral or derivative curves.
When a cursor is active, the menu adds Hide Cursor to remove it.
Escape key. Press Esc to cancel any active cursor, end a Pick Peaks operation, or exit a zoom. The figure replots automatically afterwards.
02Fit management
- Remove Fit Line — deletes the current fit from the plot.
- Subtract Fit — subtracts the current fit from the data. Useful for baseline subtraction, especially combined with the Box Exclude tool. The exclude tool can be used to exclude parts of the graph that you don’t want to include in the baseline fit.
03Integrals and derivatives
Once a fit is complete, two options become available:
- Cumulative Integral — plots the running integral of the current fit between the data limits.
- Derivative — plots the derivative of the current fit.
When selected, a secondary Y-axis appears on the right, a legend entry is added, and an option to remove the line appears.
One at a time. Integrals and derivatives use very different scales, so they cannot be displayed together — remove one before plotting the other.
04Data editing tools
- Box Delete — drag a rectangle across points to permanently delete them. The menu then shows Undelete to restore all manually deleted points. Manual deletions are not saved unless you save the project, or (in data-only mode) open the Edit Data form and explicitly save.
- Box Exclude — drag a rectangle across points to exclude them from fitting. Excluded points remain visible as a separate dataset (plotted in black, with a legend entry). The menu then shows Remove Exclusions to restore the full dataset.
Delete vs exclude. Box Delete removes points entirely; Box Exclude only omits them from the fit but keeps them visible for comparison. To exclude a single point, use Ctrl (Cmd on a Mac) + right-click on it.
05Peak tools
These appear only when a Peak Type function is selected from the built-in functions menu.
- Pick Peak(s) — activates a crosshair to mark approximate peak positions. The number of peaks is set in the Peak Types menu. Each click near a peak adds a position to the list shown in the feedback box; when all peaks are selected, CFTool performs the fit.
- Show Sub-Peaks — if more than one peak was fitted, plots the individual component peaks. Use Remove Sub-Peaks to hide them again.
06Best practice
- Use Box Exclude when testing the influence of outliers — it is reversible, non-destructive, and honestly reflects your data-processing steps. Excluded data points are still displayed on the graph, but excluded from the fitting process.
- Use Box Delete only when points are genuinely invalid and you are justified in removing them permanently.
- To keep your raw data intact, save as a new project or new data file before making permanent edits.
- After deleting or excluding points, verify that the legend and fit indicators reflect the intended data subset.
Toolbar interaction. While the Pan or Zoom tool is active, the right-click menu is disabled — deactivate the tool to restore it.

