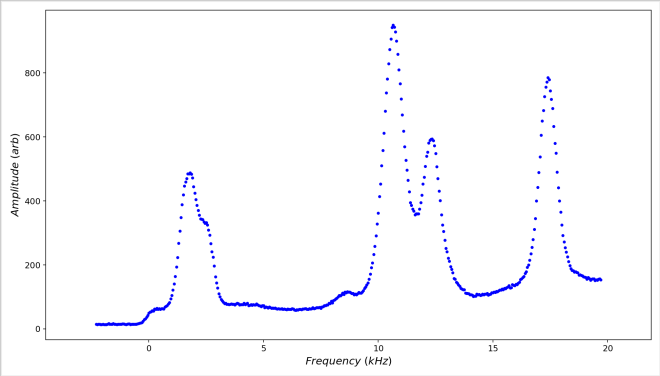
Take the graph above. It has a baseline offset and a rising baseline, both due to measurement effects. In order to fit this graph, it is helpful to correct these issues before fitting. Both of these adjustments can be achieved using tools from the Context Menu, specifically the Box Delete tool, the Box Exclude tool and the Subtract Fit tool. Let’s assume we know that the baseline tends to rise in an approximately parabolic fashion with frequency
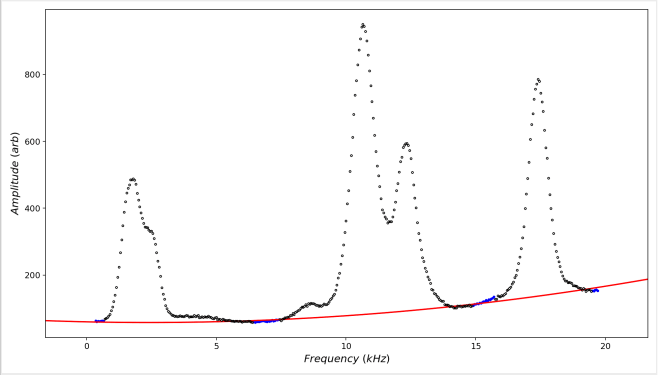
The second graph has had the data below y=0 removed using the Box Delete tool and then the Box Exclude tool has been used to exclude most of the data (black circles), leaving the remaining active data (blue dots) close to the minima between each feature. A 2nd order polynomial has then been applied to the active data. Any suitable fit could be used, depending on the expected characteristics of the baseline. A higher order polynomial for example, a power law function or any custom function, as long as the function does not generate unjustified distortions to the data after subtraction.
Finally, the Subtract Fit tool has been used to subtract the baseline. This restores the excluded data (but not the deleted data) and subtracts the polynomial fit from all of the data, leaving the full data set with the background subtracted.
Finally, if you wish to reverse the background subtraction, a Restore Data item will have replaced the Remove Fit item in the context menu.
