CFTool can show a second line on the same axes. You can either:
- Plot a second dataset and fit it independently, or
- Plot just a function (no second dataset) evaluated on the X values of the first dataset using the Fitting Coefficients table as absolute values.
This is useful for comparisons (measured vs measured, or measured vs model) without juggling multiple figures.
You can only add a second line after a first data set has been loaded.
Option A — Second dataset + independent fit
Enable the second line
- In the main window, enable Second Line (“Add Line” button) to activate the additional line – the button will indicate “Line 2 Active”.
- Open File → Edit Data and enter/paste your first dataset as usual. Save this data set.
Load / enter the second dataset
- Add a second dataset in the Edit Data form, or by opening a data file with File → Load Data
- Ensure both datasets have X and Y (including σXand σY where relevant).
- Save the second data set. This will create a second data file so use a different file name.
- Choose a fit type for the second line (it can differ from the first), or enter a custom fitting function.
- Use the Fitting Coefficients button to set starting values / bounds, then click Run Fit for the second line
What gets plotted
- Line 1: your primary dataset and its fitted curve (if enabled).
- Line 2: the second dataset (markers) and its own fitted curve (solid line).
- Legends, colours, and markers follow your current style settings; you can adjust in Plot Settings and the Label Editor.
Tips: You can toggle line 2 on/off while keeping line 1 visible.
If line 2 is visible, you can edit its line labels. To edit Line 1, temporarily turn off line 2, make your edit, then re-enable line 2
Option B — Function-only (no second dataset)
Use this mode to overlay a pure function (model) on top of your first dataset without loading a second dataset.
How it works
- CFTool evaluates your chosen function/expression using the X range of the first dataset.
- The Fitting Coefficients for the second line are treated as absolute values, not shared with the first line.
- This lets you sketch predictions, compare parameter sets, or show a theoretical curve alongside measured data.
Steps
- Make sure Line 1 (your primary dataset) is loaded.
- Enable Second Line, then choose Function Mode (or just choose Function Mode)
- Either select an inbuilt function or enter a custom function for line 2.
- Click Fitting Coefficients and supply the absolute coefficient values:
- Click Run Fit to draw the function using Line-1 x-value range.
Note: In Function-only mode, there is no fit for the second line because there is no Y data to minimise against. It is a computed curve from the coefficients you set.
Choosing expressions & coefficients
- CFTool uses the same expression engine as your fitting. You can use
sin,cos,tan,exp,log,sqrt,abs, etc., and standard arithmetic. - Use
xfor the horizontal axis variable. - Coefficient names must match those in your expression (e.g., a, b ,c).
Error bars & algorithms
- Data + fit (Option A):
- Any σ columns supplied for line 2 are used normally. If you want to enable error bars for line 2, have line 2 active and select as normal. (Similarly for line 1)
- Fit statistics, parameter errors, and residuals are available for line 2 just like line 1. You can toggle between the fit statistics using the tabs below the statistics pane.
- Function-only (Option B):
- No errors or residuals apply (there’s no second Y data). Line 1 residuals will show.
- The curve is drawn from the expression and coefficients only.
Workflow suggestions
- Measured vs measured: Load your reference dataset as line 2, fit with a different model, and compare parameters.
- Measured vs theory: Use Function-only to plot a theoretical prediction against your experimental data.
- Parameter exploration: Keep Function-only on, tweak coefficients in the second line’s table, and watch the predicted curve update.
Tips
- Axes & scaling: Both lines share the same axes. If you wish to toggle between scaling to the data or the margins, use Right-click → Scale to data/margin on Both lines.
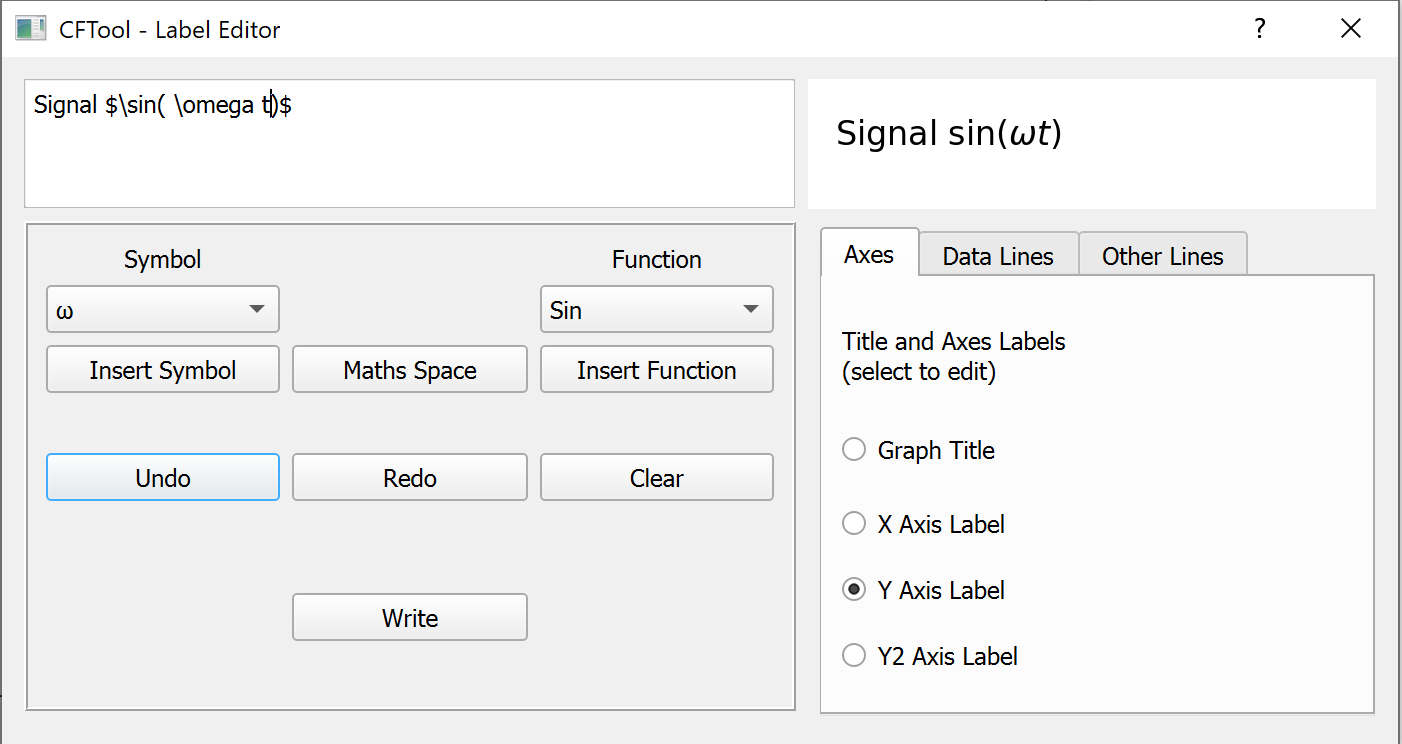
- Legend clarity: Rename line labels in Label Editor so the legend clearly distinguishes data and function.
- Shared vs independent params: Line-2 parameters do not affect line-1 fits. In Function-only mode they are absolute values; in data+fit they are initial guesses and bounds for line-2’s own fit.
- Exporting figures: Use the Print tool; both lines and legends are included in PNG/JPG/TIFF/PDF/SVG outputs.
- Saving projects: In Project mode, both line configurations (data sources, expressions, coefficients, and toggles) are saved with the project.
