The Label Editor allows you to edit any of the graph labels using MathText formatting.
This gives you full control over axis, title, and line labels, including the use of Greek symbols, subscripts, superscripts, and mathematical expressions.
Opening the Label Editor
You can open the Label Editor in two ways:
-
From the File menu – choose Label Editor.
-
By clicking directly on the plot – click on the label you wish to edit.
-
If a label is currently blank, click in the region where the label would normally appear, near the centre of the corresponding axis or title area.
-
Selecting and editing a label
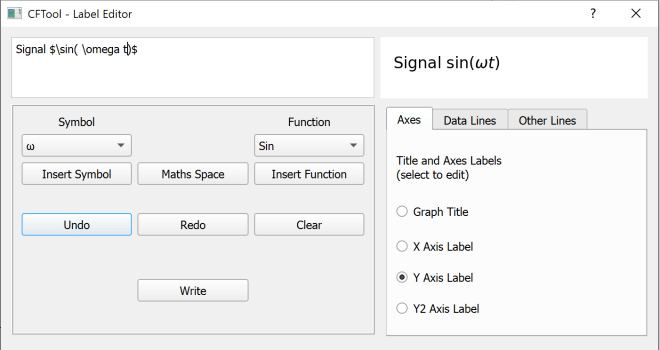
The Label Editor window contains tabs for each label type (axes, title, legend, and line labels).
-
Click the tab for the label category you wish to edit.
-
Select the specific label name from the list.
-
The current MathText code for that label appears in the edit box (top left).
-
The formatted result appears in the output box (top right).
-
-
Make changes in the edit box — the output preview updates automatically so you can check your syntax and layout before writing the label back to the plot.
Using MathText
MathText expressions are enclosed between pairs of $ symbols.
Everything inside the $...$ pair is rendered using a mathematical font; text outside is shown in the normal label font.
Example:
This inserts the lowercase Greek omega symbol.
You can combine text and symbols:
This produces: Amplitude A₀ (mV)
Common symbols and functions
The editor provides quick-insert buttons for:
-
Common Greek letters
-
Frequently used functions (sin, cos, exp, log, etc.)
-
A maths space for spacing within equations
You can also manually type any symbol or function supported by Matplotlib’s MathText.
A full list is available on the official MathText reference page.
Live preview and syntax checking
The output window updates automatically as you type, so you can see exactly how the label will appear.
Check carefully that:
-
Each
$symbol has a matching closing$. -
Function and symbol names are correctly spelled and preceded by a backslash
\.
If the preview does not update correctly, check these points first.
Editing line labels and legend entries
For line labels, you can edit each label individually.
Tick boxes beside each entry control whether that line’s label appears in the legend.
This lets you selectively hide or show lines in the legend without removing them from the plot.
Applying changes
When you finish editing:
-
Click Write to apply the change immediately, or
-
Simply click on another label — the current label will be written automatically before switching.
Tip: Always confirm that the output preview looks correct before writing; this prevents accidental blank or malformed labels.
MathText quick examples
Examples of common MathText expressions
Expression Renders as Meaning $\alpha, \beta, \gamma$α, β, γ Greek letters $x^2$ or $x^{2a}$x² or x2a Superscript $E_0$ or $E_{ch}$E₀ or Ech Subscript $\frac{a}{b}$a b Fraction $\sqrt{x}$√x Square root $\sin(\omega t)$sin(ωt) Function form Combine standard text and MathText freely — for example:
Intensity $I/I_0$→ Intensity I / I₀
