New data can be entered, or existing data modified, in the ‘File >> Edit Data’ menu, which opens the Data Input Form, and displays a table for data entry and manual alteration.
CFTool operates in two modes; Data mode and Project mode.
Data mode saves simple text files as columns of data, and this is the default startup mode. In this mode, whether you use “Save Data” or “Save Data As”, the data entry window always saves a text file to disk before returning you to the main plot window, unless you cancel the operation or close the edit window. Once the values have been entered, pressing “Save Data” will write the data to a text file, and, if you are entering new data, you will be asked to name the file, or else the currently active text file will be updated and saved. The new or modified data will then be plotted in the main window. “Save Data As” simply writes the data to a new text file, leaving any existing file unchanged and then plots this new file to the main window
You enter project mode by saving the current graph using “Save Project” in the File menu, or by opening an existing project. Project files contain the raw data, as well as formatting information, any fit that you used and other modifications. Saving a new project does not delete the original data text file, both are retained. After that, modifications to the project will only be saved to the project file. In project mode, the Data Input Form is used to modify the project data, and pressing “Save Data” will update the project but not save the data to disk. Saving the project can only be done in the File menu. In project mode, pressing “Save Data As” will create a new text file and close the open project file without modification, retaining both files, and putting you back in data mode.
If you make changes to the table that you then wish to discard, simply close the window with the X in the top toolbar.
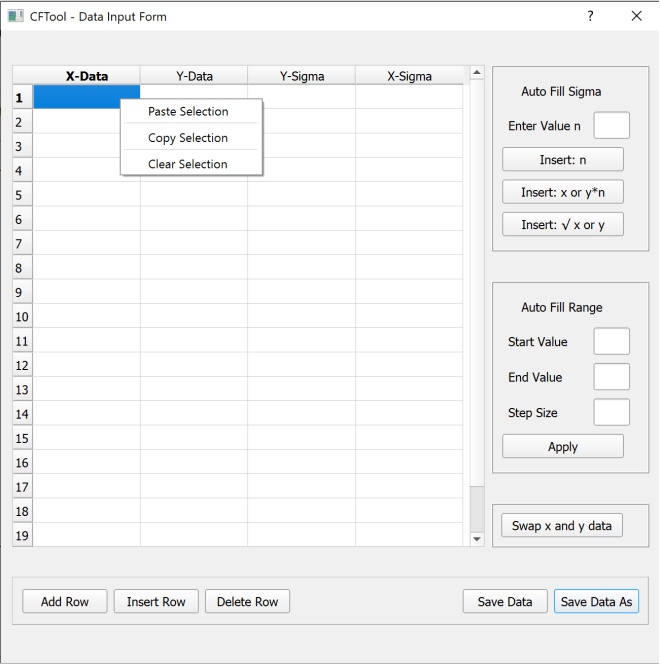
This table will have three columns when ‘Levenberg-Marquardt’ or ‘Trust Region-Bounds’ are selected in the fitting algorithm selection box, whereas a fourth (X-Sigma) column will appear if ‘Orthogonal Distance’ is selected. This is because the Orthogonal Distance algorithm can apply uncertainties in x-data.
The data table can be manually edited, or it can take blocks of data pasted from a spreadsheet e.g. Excel® or similar. You can also cut and paste individual columns of data directly from Spyder® variables. To paste a column, or columns, of data select the table box to the top left of your intended paste area, right click and chose “Paste Selection” (or use ‘ctrl +V’). The new data will be pasted down from and to the right of that box; this is to avoid the need for pre-selecting a large number of boxes. This process will replace any previous data in the boxes covered by the new data, but not those above or below the block size of the pasted data.
If replacing a complete data set, it is advisable to clear the previous data by either using the “Clear Form” option in the file menu (which clears everything including the current file name) or by selecting all of the current data in the table (‘ctrl +A’) and then “Clear Selection” in the right click menu (which retains the current file name when saved)
To select an individual column of data, click the column label at the top. The data in the column can then either be cleared or copied.
To the right hand side and below the data table there are some tools available to help manage the table:
At the top right there is Auto Fill Sigma, where you can either fill either the x or y-sigma column with a constant value for all values (as entered in the text box “n”) or with a value equal to “n” multiplied by the corresponding x or y value. You can also fill with the square root of the corresponding x or y value. To choose which sigma column to fill, simply select any box in the target column (only necessary in four column mode).
Below this is the Auto Fill Range tool that allows you to automatically insert a range of values into any column. Simply input the start and end value of the desired range, along with the step size, into the text boxes and then select the position in the table where you wish the range to start. Clicking Apply will fill the table column downwards from that position, overwriting any existing entries. Descending ranges are possible – use a negative step size and set the start value as the highest value required.
There is a swap x and y data button that allows swapping of the values in these two columns.
Below the table, there are buttons to allow you to Add a row at the bottom of the table or to Insert a row above the currently selected table box or to Delete a row at the currently selected position.
